Understanding your Dashboard
Understanding your Dashboard
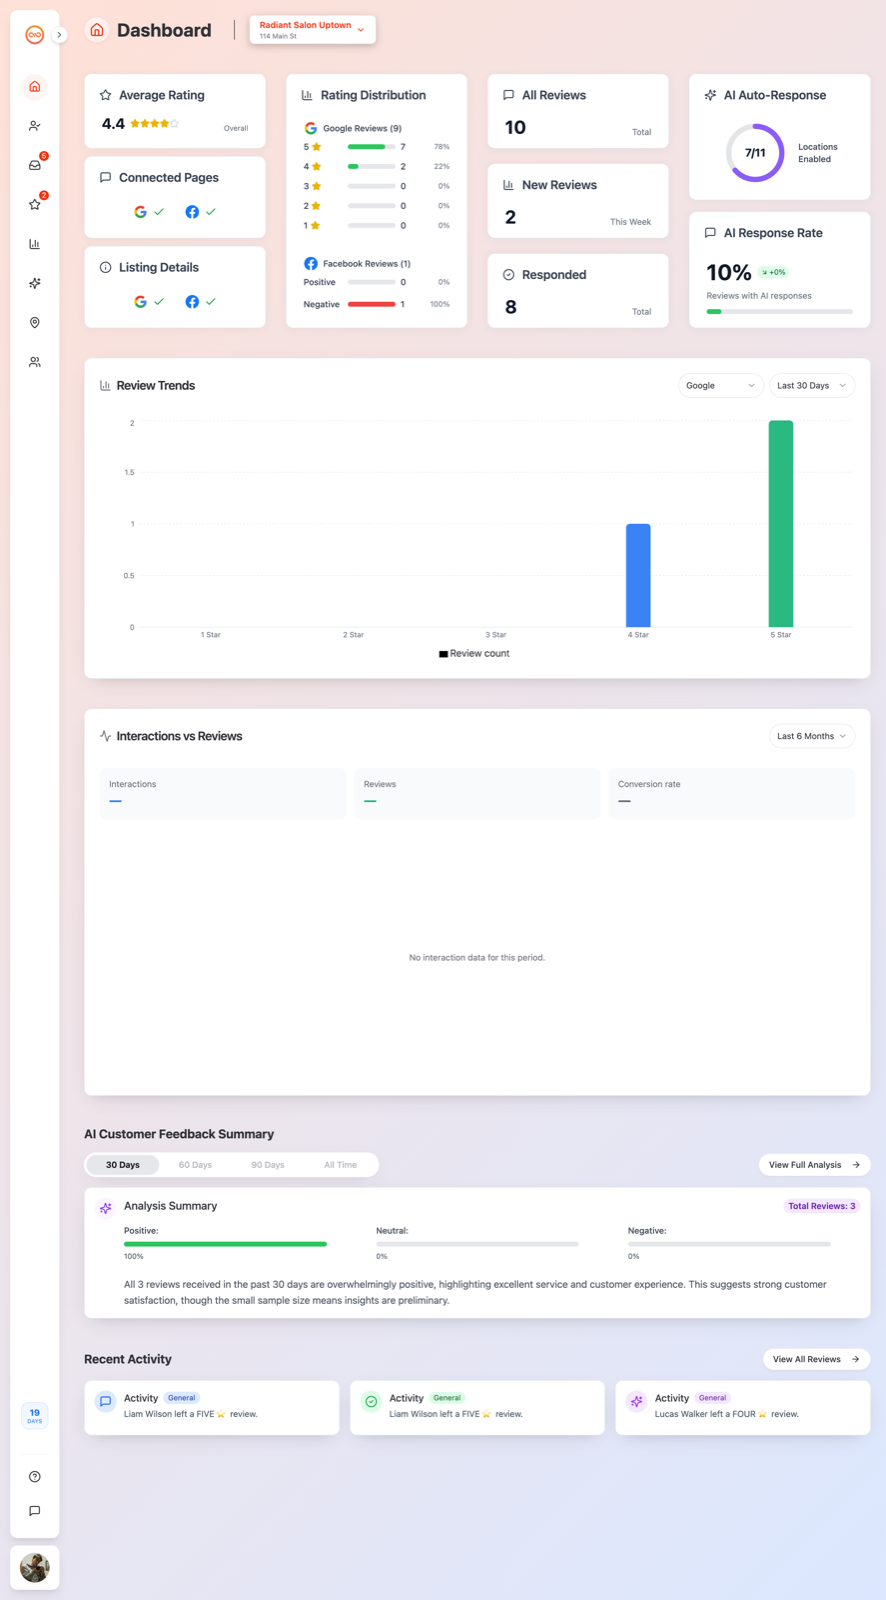
Your Dashboard is the first screen you see after logging in, and it gives you a one-glance view of your business's online reputation for the location you have selected.
Before you start
- Make sure a location is selected. The location selector sits right next to the Dashboard title and shows the location's name and address.
- The first time you open the Dashboard for a location, Qrese pulls in your latest reviews. This can take up to a couple of minutes — you'll see cards with Syncing latest data... or Syncing latest reviews... while it finishes.
What each card means
Almost every card is clickable and takes you straight to the related page.
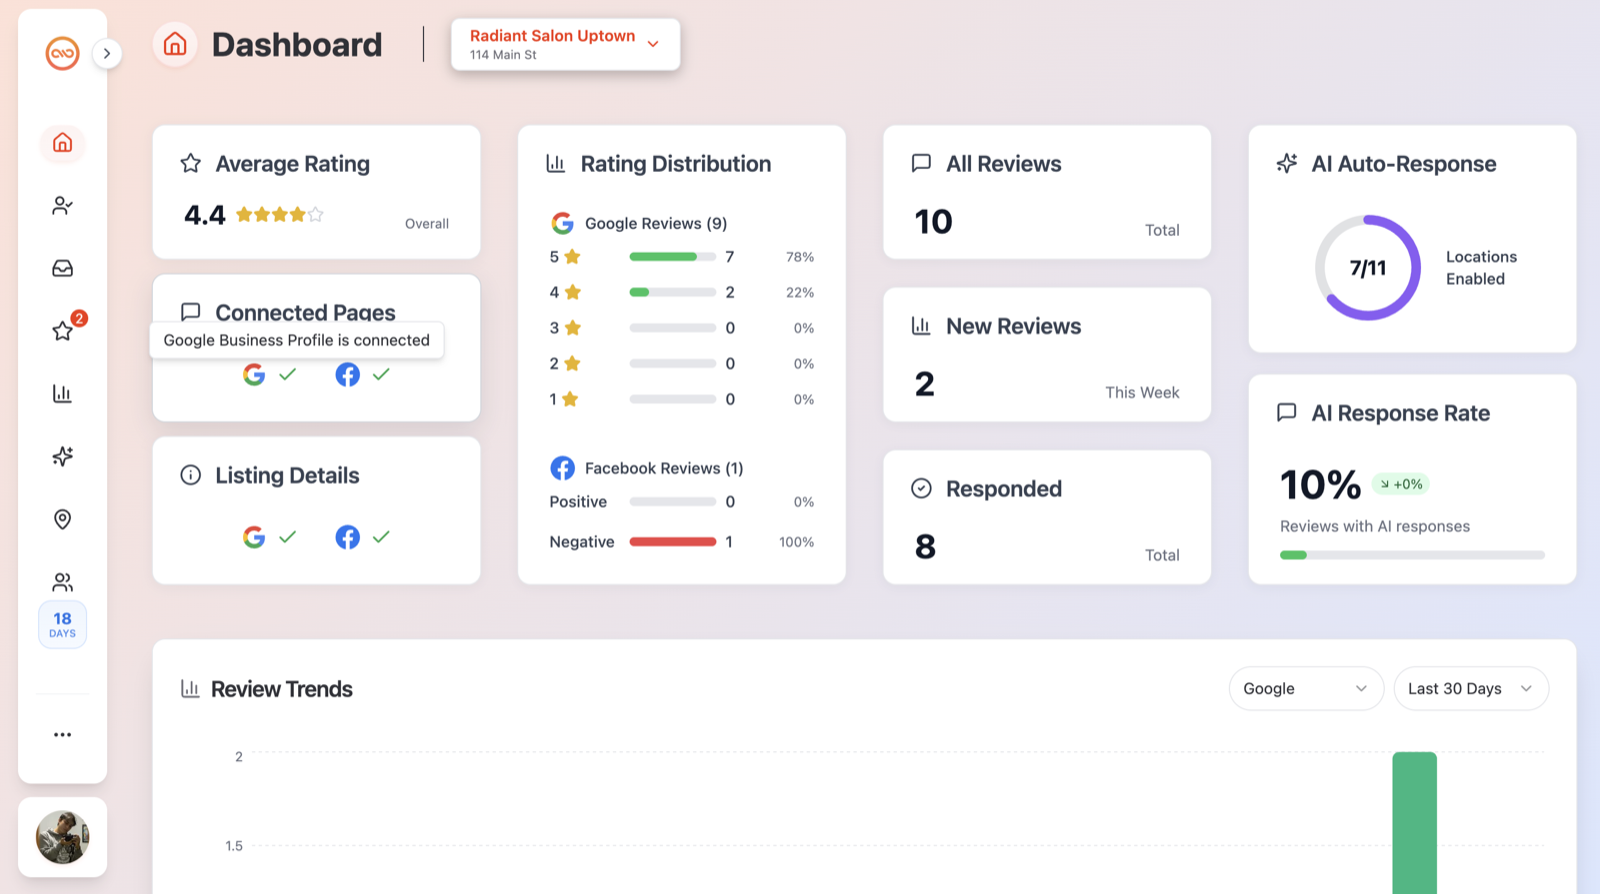
- Average Rating — your overall star rating for this location, shown to one decimal with a row of stars. Click it to open the Reviews page.
- Connected Pages — shows Google and Facebook icons with a green check (connected) or a red X (not connected). Hover an icon for an explanation, such as "Google Business Profile is not connected — Go to Locations page to connect this page." Click the card to open the Locations page.
- Listing Details — a quick check on your business listing details, with Google and Facebook icons. Click it to open the Locations page, where you can review your listing information.
- Rating Distribution — a breakdown of your reviews. Google Reviews shows 5-star to 1-star bars with counts and percentages; Facebook Reviews shows Positive and Negative bars. Facebook numbers only appear if a Facebook page is connected. Click the card to open the Reviews page.
- All Reviews — the total number of reviews for this location. Click it to open the Reviews page with all reviews shown.
- New Reviews — the number of reviews that are still waiting for a response from you. Click it to open the Reviews page filtered to reviews you haven't answered yet.
- Responded — the total number of reviews that already have a response. Click it to open the Reviews page filtered to responded reviews.
- AI Auto-Response — a donut showing how many of your locations have AI auto-response enabled (for example, 3/5 Locations Enabled). Click it to open the AI settings page.
- AI Response Rate — the percentage of reviews that have an AI-written response, with a progress bar. Click it to open the AI settings page.
Charts and summaries
Below the cards you'll find:
- Review Trends — a bar chart of your recent reviews. See Reading the Review Trends chart.
- Interactions vs Reviews — how Google Business Profile activity turns into reviews. See Interactions vs Reviews.
- AI Customer Feedback Summary — an AI-written summary of what customers are saying. See AI Customer Feedback Summary on the Dashboard.
- Recent Activity — your three most recent review activities, with a View All Reviews button that opens the Reviews page.
Tips
- Dashboard numbers are refreshed once per calendar day for each location, so a review posted minutes ago may not change the cards until the next daily refresh.
- Hover the icons on Connected Pages before clicking — the tooltip tells you exactly what's connected and what isn't.
Troubleshooting
- "Error loading KPIs." — the numbers couldn't be loaded. Refresh the page; if it keeps happening, contact support.
- "No KPI data for this location." — there's nothing to show yet for this location, usually because it's brand new or has no reviews.
- Cards stuck on "Syncing latest data..." — the very first sync for a location can take up to about 2 minutes. Give it a moment and the cards will fill in on their own.